30 July 2002
Printer Friendly Version
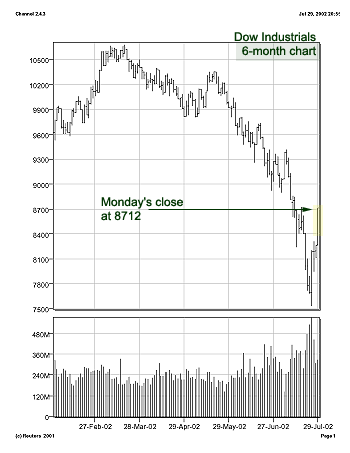
So what if the Dow goes up by 15% over the next three to four months. That's no consolation to anyone that watched it drop 30% in the past four months. To recover losses like that the average would have to rise 40% off its recent bottom, near 7600. Besides, a fifteen percent move off that bottom means an 8740 target, which is only 40 points away. In less than a week the bulls erased one third of their prior 4 months worth of losses; it is a feral display of volatility. The gains were broad during Monday's dash of usual end of the month momentum, or at least 'usual' during the bull market. The Dow average gained 447 points.
 All
the major US stock market averages gained more than five percent save
the Dow Utility Average, which gained only 1.4% on Monday. Advancers led
decliners 9:2, and nearly 2 billion shares changed hands on the big board.
It was a solid bullish romp. Technically, the move was significant provided it was not related to month end nonsense, but even so, the significance was minor.
What I mean is that bears still have control over the short term down trend, defined by 925 on the S&P 500, 1420 for the Nasdaq composite, 490 in the NYSE composite, and 8700 for the Dow Jones Industrials, which closed just above resistance at 8712 Monday. The rest of the major US market averages closed below nearby resistance, despite the bullish four-day affair so far.
Still, the surprising nature of the momentum should be disturbing to the bears. If so they may find solace in the sentiment data. The S&P 500 Call-Put ratio reveals just about the same amount of bullish sentiment today as it did at May's bullish levels - at the tail end of a small two week rising wedge in the average that represented the bullish rebuttal to an early May break down from a (intermediate) double top.
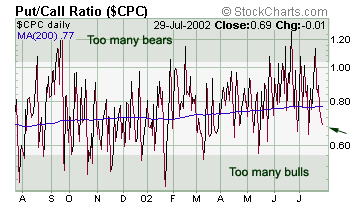
The CBOE put-call ratio registers a less bullish reading than it did in May, but infers as much bullish sentiment as at any time since May. A reading in this statistic below 0.60 has proven to be a reliable sell signal so far this year.
 The
current reading below the 200 day moving average (blue line in the chart)
only means to us that the indicator is closer to giving us a sell signal
than a buy signal, and this while the bulls have hardly put a dent in
the bearish technical arguments.
Keep 'em bullish boys. One or two more days of this could do it. Or we could get a turn around for the bulls that results in a bear market rally, sort of like the summer rally everyone's been expecting, only from far lower levels. Or we could get a brand new bull market.
But I don't think this is much more than a bullish rebuttal while the market makes its invariable transition from the Tech sector to the mighty Dow for its bearish leadership.
We've argued for almost a year that the Dow is likely to take over the bear market's leadership job as we enter into the next phase of the bear market, where the broad market's losses tend to accelerate. What better time for this transition than when these averages fall through their 9-11 lows to new four and five year lows, signaling an extension to the two year primary bear market?
The bulls of course still largely insist the transition will never happen, and also that the worst of the bear market be behind us.
From a technical standpoint I think it's almost necessary to see the Dow capitulate, meaning relative to the broad market, before we can legitimately call for the end of a bear market. I labor under the impression that the Dow Industrials fall last in a bear market (primary), but normally lead us out of it also.
Stocks such as IBM for instance were able to resist the technology bear until April of this year. It just broke down, as did the rest of the market soon afterward - in July (this month) all the averages sent us another primary bear market signal, but only the Dow had recovered it since.
When something breaks out or breaks down, usually we look for confirmation, which often means an assessment of the rebuttal. The current stock market rally is thus a rebuttal to July's primary sell signal, in our view. The challenge facing the bulls is for them to take back all of July's losses in order to show us that they weren't real. But it's going to be tough to sell us on the idea that the bear market is over, particularly to the extent the argument is premised on the idea the Dow never participated in the bubble in the first place.
Fallacious Bubbleheads
With religious fervor, Wall Street media henchmen (and women) have been
applying Mr. Greenspan's bubble model to the markets. The model was first
developed after his "irrational exuberance" speech in 1996 in which he
forecast a major market top boosted him into top spot for the lame duck
economic forecaster of the year award yet again (perhaps the award is
a prerequisite for the transition to a dove). In 1996 you see, the Dow
was hovering around 5500. His speech resulted in one last dip to near
5300 then the market was never going to see those levels again, to this
day.
From that day forward, a bubble definition was only to be applied in hindsight, for if the Mighty Quinn couldn't tell the difference ahead of time, no one could. From that day forward, millions of individual investors making investment decisions throughout the land could not be wrong collectively. In other words, markets were always going to be right, just like it says in the textbooks.
The markets have become so efficient that it is irrelevant whether any or all of these individual investors understand the way that inflation works itself through the system because collectively they do understand. It doesn't matter that inflation affects the individual's valuation judgment, or that it breeds irrational exuberance and manifests as malinvestment and debased currency. None of that matters because the markets work just like they say in the textbooks, efficiently. They're never wrong.
So why are they so volatile if they're so efficient? To which the devout bull would probably answer they weren't volatile until the recent crisis of confidence, commonly attributed to the corporate crime wave, as if it didn't exist on the way up.
The aggressive accounting tactics, I'll say it again hoping someone will hear, were clearly visible during the bull market. But the collective brilliance of the market failed to see them for what they were: a consequence of the bubble, which resulted from the inflation that the Fed is supposed to monitor. So of course, if the Greenspan Fed can't see a bubble forming right under its collective feet while their "pedal is to the metal" at the local printing presses how on earth could anyone else see one? Or so goes the parable.
In true form, one analyst after another says it. At first, it's absurdity gets a shake of the head, the next time it is heard, it gets a twitch of the lip, the third time it's heard it gets a turn of the head combined with the wonder of how these people can say it over and over again. It must be that nobody has questioned it. So we will.
The nineties stock market bubble was not simply isolated to the technology sector!!

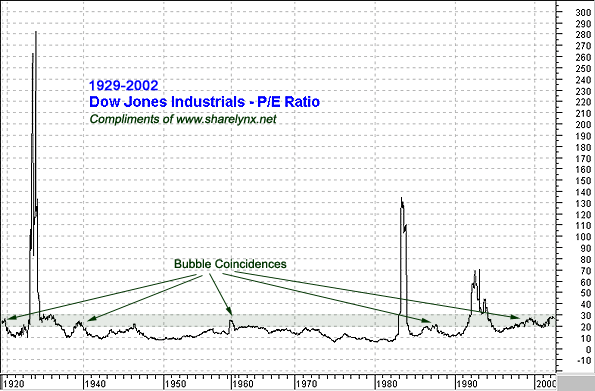
It's just that you'll never get 150 P/E ratios out of the blue chips until they're profits disappear altogether. Even the 1929 stock market bubble resulted in only a P/E ratio just above 20. It wasn't until after the crash that the ratio spiked up to over 200 on several occasions in the early thirties. During the late fifties, according to data from the chart above (just ahead of the go-go era for tech stocks) the Dow Industrials got up to about a 25 times trailing earnings multiple. I'm sure it was cheap with respect to earnings outlooks. Excluding the spikes in this ratio usually attributable to profits depressions, the only other time the Dow Industrials were priced as high during their boom phase was just before the 1987 crash, during the late nineties, and now.
There are two ways to argue against us. The first is that many Dow stocks are also technology stocks and they heavily influence the multiple on the Dow average. The second is that the P/E ratio is a far too rudimentary measure of value to be useful in today's world of high finance.
Indeed there are seven Dow components we would call pure technology plays. They are Hewlett Packard, IBM, Intel, Microsoft, SBC Communications, AT&T, and United Technologies. These stocks were priced at between 30 and 60 times earnings during the best part of the nineties boom in 1999.
But these aren't fly by night operations. To imply that the impact on the rest of the economy, and other markets, from the valuation distortions reminiscent in only these stocks was neutral is a bullishly biased inference today.
Moreover, stocks like Du Pont went for 50 times earnings in 1998. American Express went for 30 times earnings in 1999; Disney went for better than 70 times earnings in early 2000; GE went for 45 times earnings by mid 2000; Home Depot went for 60 times earnings in early 2000; Johnson & Johnson traded at almost 40 times earnings during early 1999; Coca Cola traded at 50 times earnings from 1998 to 2000 then it traded up to almost 90 times earnings in 2000 when earnings began to fall; McDonald's traded up to about 38 times earnings in early 1999; Merck traded just higher than 35 times earnings in 1999; Wal-Mart traded for 50 times earnings in 1999. Should we continue?

Reuters-Bridge
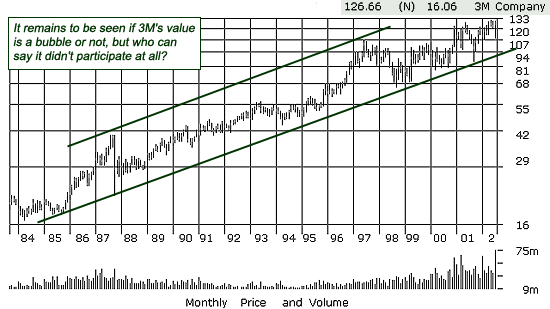
The list is long, and the bubble permeated the entire stock market, not just the tech sector. Mostly the tech sector, but not "just." Even 3M, the epitome of old economy stocks in the Dow, traded for 28 times earnings in 1999, and today trades for almost 30 times earnings. Clearly then, it wasn't only the technology sector that influenced the Dow's multiple during the height of the boom, or even now.
To say that the bubble is isolated to the technology sector is a fallacy. What's more, it's probably damage control by our economic managers to promote that fallacy, as if the inflation was still under control.
But even if it isn't that, it is the rudimentary application of the Greenspan model for a bubble, which the world's blue chip analysts are blindly applying to the markets that have now come down the most. Since the tech sector has given up most of its gains, that is where the bubble must have been, right? The Dow has been dropping less quickly so therefore it can't be a bubble yet. This application of hindsight bubble-o-nomics is going to acknowledge a bubble only if and when the blue chips fall much further.
Of course, there are better measures of value than the simple P/E ratio. But they'll all show similar results in hindsight. In our view, value is subjective anyway, so it is not the actual number that matters, but which way it's likely to go that does. Nonetheless, this is a big topic and one we'll leave for subscribers in a future issue.
It is our view at the moment that the price of gold & gold shares have discounted a material bounce in the Dow as well the US dollar, both of which are underway. We don't share the enthusiasm for Wall Street assets that the 4-day bullish affair implies that others have at the moment.
Until Monday, the bond markets were able to hold on to their gains. But Treasuries were knocked back a few notches as confidence did in fact grow in a stock market recovery on Monday.
Further losses in the bond are likely to first signal a rise in this confidence, but then it is likely that their rising yields will also lower the equity risk premium yet again.
The persistent decoupling of these two assets will continue until the bear market has run its course. The sticky bond yield has been an efficient primary controlling variable for equity values, and we expect it to continue so.
Well, who needs the Fed anyway?